Point Blank – May 11, 2017
On Spurs/Rockets after “Heartbreak Hill”…It’s 2017, and I still haven’t figured out Michael Pineda yet…
Wizards/Celtics on Wednesday brought yet another second-round blowout into play, a game devoid of mystery after some strong early Boston defense set the tone, and a doubling of three-point efficiency on an almost identical number of attempts (Celtics made 48.5 percent of their 33 tries; the Wizards just 24.1 of 29) built out the margin. A wild card in the equation was the way Boston defended the paint, eight blocked shots from an area that has been one of the prime weaknesses for the team.
Now on to Thursday, and one of the most difficult games to handicap I have come across in the playoffs in quite some time. And on the same sports card Michael Pineda is pitching, one of the toughest starters out there to establish a good grade for. So in the process of trying to find edges, today will be much about the vagaries involved in the processes.
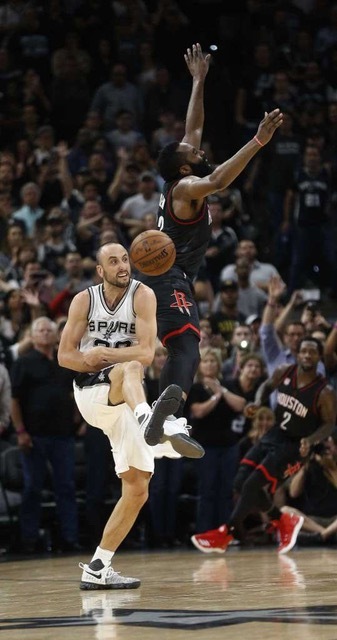
SAN ANTONIO/HOUSTON – Does Game #6 begin where Game #5 left off
Many folks in the marketplace seem to have an opinion on tonight’s direction, with the Rockets having touched -7.5 a few times in the early morning trading, before being brought all the way back down to -6 at Pinny, then drifting back to -6.5. I don’t have much opinion at all, and likely won’t develop one over the course of the day.
The problem stems from having closely watched every minute of Game #5 on Tuesday, and seeing how the flow altered as the players wore down. It ended perhaps with the most fitting sequence of all, the ball on the final shot ending up behind the shooter, rather than on an arc towards the basket.
Let’s look at that game flow through a simple mode, but one that lays it out well -
Pts FG 3-pt
First Q 61 22-44 10-20
Second Q 57 21-43 4-11
Third Q 53 22-51 7-22
Fourth + OT 46 15-51 6-28
It was fingernails on chalkboard at the end for both offenses, the Rockets not having much left in the tank in their seven-man rotation, and the Spurs unable to run quality sets without Kawhi Leonard/Tony Parker, and with Patty Mills on fumes. That leads to the obvious question as to how much that fatigue carries over, and it calls for some perspective –
Season High Minutes
Eric Gordon (43:39)
Patty Mills (43:14)
Danny Green (40:26)
Manu Ginobli (31:36)
Second Highest
Patrick Beverley (41:42)
Jonathan Simmons (31:39)
Third Highest
LaMarcus Aldridge (42:10)
And there were also long exhausting stints for James Harden and Trevor Ariza that may not fit the above categories, but took a toll – Harden was 0-4 from the field with four turnovers over the final six minutes of play, while Ariza was on the court for 9:47 of the fourth quarter and OT without scoring a point, and with only one rebound.
So now the obvious problems come into play – how much carry-over is there? Is this a new race, or are these marathoners trying to finish an on-going one after having had to deal with “heartbreak hill”? And of course there is the issue of how healthy Leonard is going to be. Will he be hampered, or did he catch a bit of a break by not having to extend his minute count (38:20) by sitting out the OT?
Does Mike D’Antoni dare go beyond his seven-player rotation? Naturally he wasn’t going to tip his hand, but this answer to a media query may have been brutally honest - "I don't know. I didn't think about it too much on the way here, but I'll think about it and I'll let you know tomorrow or the next day or maybe not. I have no clue."
And Gregg Popovich also has decisions to make. After starting Dejounte Murray in both Game #3 and #4 he did not play him at all on Tuesday, which put Mills into such an extended role. Might he go to Murray early tonight to prevent such a cycle from taking place again?
I will be watching closely for early tells in this one that may lead to something with an edge on the In-Running board (setting those prices will be a challenge for the oddsmakers tonight), but between now and tipoff I don’t expect to be adding anything from this one to the portfolio. I get some moderate Under chimes at 215, but that was gobbled by an early bird, and I don’t expect to see that price point show again.
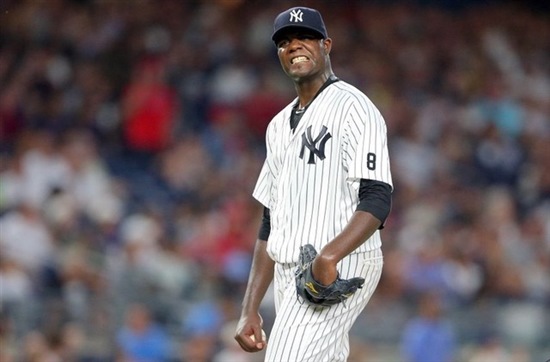
Item: Time for the annual Michael Pineda feature
As noted in the opening, Pineda is one of the most fascinating, and frustrating, pitchers to have to deal with, a guy with flashes of Cy Young and Hall of Fame moments because of outstanding stuff, but with one particular weakness that may simply never go away.
When Pineda is good he is damn good, a combination of an explosive fastball that causes a lot of swings and misses, and also the ability to work low in the strike zone, an improving GB% now sitting at 50.0 this season. You know the drill – strikeouts and groundballs add up rather well in terms of run production, and Pineda is in that unique stratosphere of 11.2 K/9 and 50.0 GB%, all the while with only 1.9 BB/9. The problem is that when he misses his spots he gets punished severely, so let’s set some perspective on that.
Why would there be such fascination with a pitcher that has gone 21-23 with a 4.46 ERA over the last three seasons, a sample of 371 innings that would seemingly classify him as being below average? Let’s go to “xFIP”, which neutralizes home runs to league average, and take a look at the best MLB has to offer over that stretch, of pitchers that have worked at least 350 innings -
1. Kershaw 2.24
2. Syndergaard 2.73
3. Carrasco 2.95
4. Sale 3.02
5. Pineda 3.07
That is special company. As for 2017, of the 114 pitchers that have worked at least 30 innings Pineda is #6 in K%, #2 in K/BB rate (only Chris Sale better), and #8 in SWS%, all the while getting half of the contact to come on the ground. But not only has his nemesis, the gopher ball, been in play with seven allowed already, the ratio is getting even worse. Let’s look at the HR/FB counts for Pineda over the last three seasons, and compare them to the MLB average rates -
Pineda MLB
2015 14.7 11.4
2016 17.0 12.8
2017 25.0 12.8
Of those pitchers that have worked at least 350 innings over the last three seasons, only James Shields has a higher HR/FB rate.
Is there a logical explanation for this? I am among many that have been searching, and at one point there appeared to be a smoking gun, Pineda getting tagged for what seemed like a significantly higher HR rate when working from the stretch. In 2016, for example, it was 13 home runs in 298 PAs with runners on base, vs. 14 over 458 with no one on, and Pineda working from the windup. But so far in 2017 all seven homers allowed have been from the windup, with no one on base. And so much for that.
What is the cause of the home run counts for a guy that both limits contact, and limits fly balls? I am among many trying to pick that lock, and for now just can’t open the safe.
In the Sights, Thursday MLB…
Gerrit Cole is showing signs of being back to full health, which is earning him some respect in the betting markets, but the rest of the Pirates just aren’t much at all these days. Having been dumped by the Dodgers 21-6 across three games to open this road trip I don’t believe tonight’s price is in the right place, and that will put #954 Arizona (9:40 Eastern) into pocket, with as low as -119 out there after some early Pittsburgh money, and value holding to -125. Zack Greinke shows the stuff to match Cole, and the Diamondbacks are simply better across the other positions.
There hasn’t been a lot of sex appeal for Greinke off of his disappointing showing in 2016, but he has been throwing the ball much better to open this campaign, and let’s go to those key rate-stats to showcase the improvements –
K% BB% GB% SWS%
2016 20.1 6.2 45.9 10.4
2017 26.3 4.5 45.1 13.1
Ground balls have been steady, but his K% is the best since 2011 with the Brewers, and both BB% and SWS% are at career-best rates. The key is a slider that is being used on 25.8 percent of offerings, a career high, and it is a pitch Greinke is commanding well, which likely explains this –
2017 O-Swing%
1. Estrada 35.5
2. Scherzer 35.1
3. Greinke 34.9
Because Greinke’s control is outstanding, when he puts that slider on the edges of the strike zone he gets a lot of batters to swing, and to miss. That is a rather useful tool.
The gap in offense between these teams is major (.753 to .677 in OPS), and the D’Backs bullpen is a half run better in FIP and xFIP. That means a lot of the price point being on the shoulders of Cole, and while those are capable shoulders, it just doesn’t add up to what is being offered.
For your listening pleasure...
For some general NBA Playoffs discussion, this week's Podcast is now up -
The complete Point Blank Archive
@PregamePhd (a work in progress, feedback appreciated)