Point Blank – April 27, 2017
On Russell Westbrook and Mediaverse Mediocrity…It isn’t just Powell being better as a starter for the Raptors, but also what Valanciunas has meant to the reserve corps…On why there might be more Parker/Mills for the Spurs again tonight…
It will be a brief detour across a general handicapping point before getting to the nuts and bolts of the Thursday board, the NBA continuing to be the major focus, but the MLB boards also getting to that point in which some of the 2017-only numbers start to become interesting (once all of the teams reach 20 games it is time to begin looking harder at defense).
The first order of business is to bring a couple of key elements to the front that are a part of the daily processes for those that make investments on the scoreboards of sport – you have to be careful with what the Sports Mediaverse often puts into the headlines, while also being careful yourself to not take the first numbers you see as being the definition of something, without digging at least a little more deeply. Which takes us some portrayals in the aftermath of the OKC/Houston series that call for more scrutiny.
Item: About those Russell Westbrook +/- numbers for the Houston series
The following was posted in yesterday’s thread because of how misleading it could be, but I believe it also creates a moment to show how a deeper dive can bring an entirely different aspect to the front –
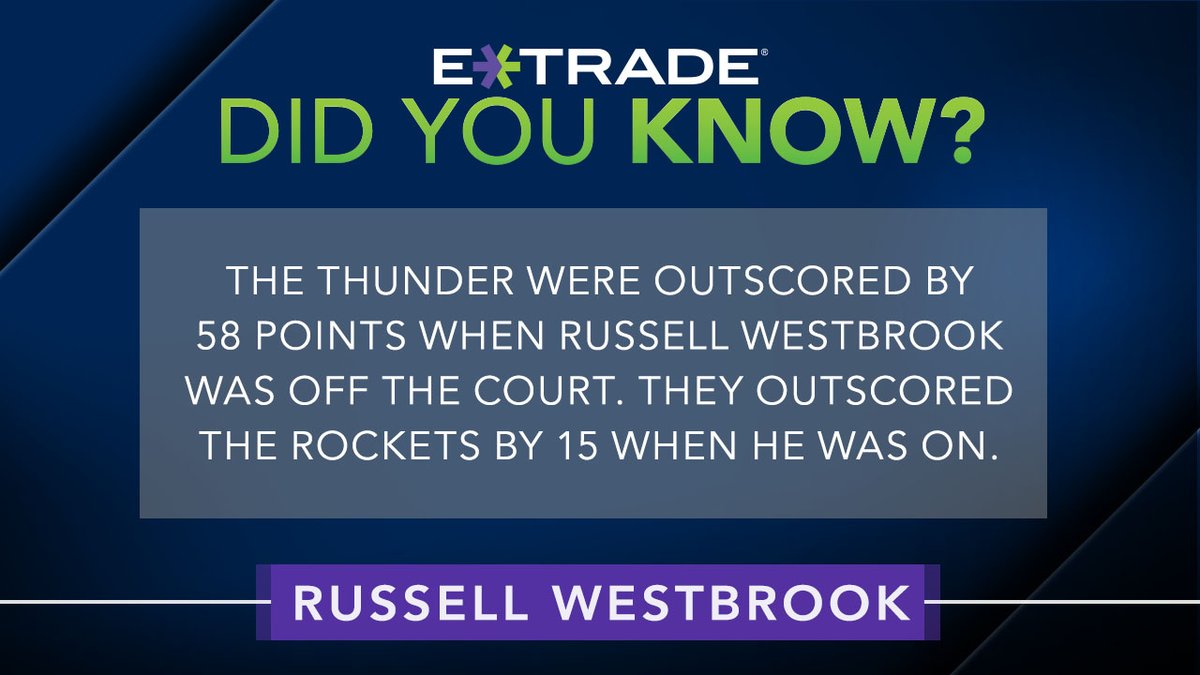
There were headlines across the landscape focusing on what seemed like a rather simple conclusion – Westbrook must really have been something for the series numbers to have had such a disparity. Yet this was a series in which he shot 38.8 percent, and turned the ball over 30 times in five games.
Here is what gets missed – Steven Adams had a damn good series. Now add that in the Thunder rotations, Adams and Westbrook are almost always on the court together. So let’s go to work on what much of the Sports Mediaverse missed.
First, in terms of that base +/- table:
On Off
Westbrook +15 -58
Adams +16 -59
Yet I could not find a trace of the Adams disparity anywhere across the Sports Mediaverse. And if we do the Net PP100 splits for the series:
Westbrook +4.9
Adams +7.7
Want a reality check? The Oklahoma City defense was utterly terrible when Adams was not on the court. One of the topics discussed here earlier in the series was that Enes Kanter was so bad in Pick-N-Roll defense that he became almost unusable by Billy Donovan, which created a rotation problem because the Thunder rely so much on his scoring off the bench. After getting exploited badly in the opener, Kanter only played 29 minutes over the last four games, and only 3:22 in Tuesday’s finale.
Let’s go to the PP100 numbers on defense, and the rebounding counts, to show just how much things changed when Adams was not on the floor -
Def Reb%
Adams On 98.9 52.0
Adams Off 131.0 43.0
As noted above, the Adams/Westbrook minutes came close to coinciding, with Westbrook playing 37 more over the five games. As such, you can see that a big part of the Westbrook +/- would have been attached to this same defensive problem. Is there anyone out there that would dare suggest the OKC defense fell off so much because of Westbrook’s abilities on that end?
Yes, there was a major gap in +/- when Westbrook was on and off the court in the series, but to attribute too much of that to him creates a false impression. It was the inability of the Thunder to guard, and their diminished ability to rebound, when Adams was not on the court that was just as big of a story, and one could legitimately make the case that it may have even been the bigger one.
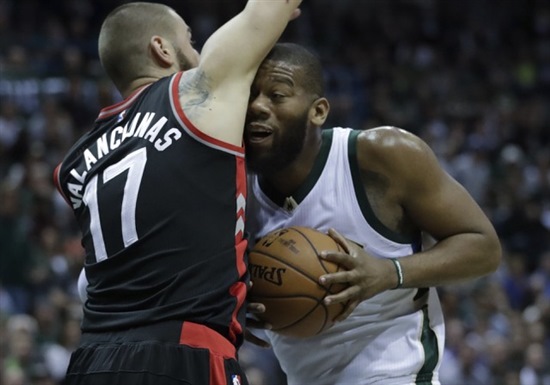
RAPTORS/BUCKS – On why starting Norman Powell, and playing Jonas Valanciunas off the bench, was literally Win-Win for Toronto
A big story in this series is how much things have changed since Powell was moved into the starting lineup for the Raptors, but this one also requires a deeper dive as well. It has become a Win-Win not just because of how Powell has fared as a starter, because also the positives from the Valanciunas performances off the bench, and that led to Win-Win on the scoreboard as well, the last two victories coming by 36 points.
The Powell numbers are superb, and also getting their proper share of recognition – 37 points on an efficient 11-18 shooting across the last two games, while also contributing eight rebounds, eight assists, three steals and two blocked shots, Toronto going +38 with him on the court. There is also an aggressiveness that is difficult to tangibly chart outside of the bottom-line scoreboard, an aggression that the Bucks have struggled to counter.
But here is what will receive much less notice, the last two games from Valanciunas:
Minutes: 43:44
FG: 8-10
Pts: 20
Reb: 12
+/-: +26
Naturally that is quite good. But note another aspect to the impact. Part of Milwaukee jumping out to a 2-1 series lead was some superb play by Greg Monroe off the bench, the Bucks going +25 with him on the court in the first three games, but a -21 in the last two, when he has had many of his minutes going up against Valanciunas. Let’s look at the Monroe production, pro-rated to 48 minutes, to show the difference the new Toronto rotation has meant in terms of his impact:
Pts/48 Reb/48
First 3 32.7 16.7
Last 2 25.7 11.3
Yes, Powell has been damn good with the starters, but it is in recognizing how good Valanciunas has been in battling Monroe that there has also been a shift in this series. Now it is up to Jason Kidd to come up with a counter.
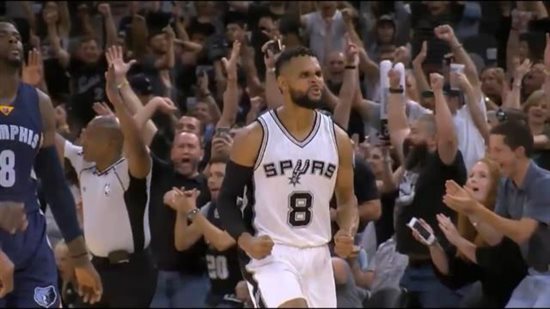
SPURS/GRIZZLIES – In this series, does Parker/Mills together make some sense (Danny Green’s defense is largely wasted vs. the Grizz)
The Spurs broke Game #5 open with a late 10-0 run, a pair of triples by Patty Mills being a key inside of the sequence. Part of what opened the floor for those shots by Mills was a tweak in the rotation – after he and Tony Parker were only on the floor together 24 minutes all season, that was the pairing for many of the key end-game moments on Tuesday. Might there be more of that tonight?
There is a logic that makes it work. While Danny Green is one of the league’s best defenders at his position, unless he is going to guard Mike Conley, who he struggles against because of Conley’s quickness, good defense at the #2 spot is not a big deal against the Grizzlies, who don’t get much of their offense from that position. Meanwhile Green’s offense continues to be a problem – after shooting just 39.2 percent during the regular season it has been 35.7 in this series, including just 5-19 from 3-point range. That is part of why in a series in which the Spurs have out-scored the Grizzlies by 35 points, the Net PP100 tables show a -3.0 in the 119 minutes that Green has played.
Mills/Parker is something that Popovich will not likely use for long stretches because of the size given up, but in this particular matchup it can make sense – if one of them is forced to guard Vince Carter or James Ennis III, that does not create an overwhelming matchup disadvantage. It is the problem of Carter or Ennis chasing a smaller and quicker player that brings the advantage to the Spurs at the other end of the court.
In the Sights, Thursday MLB…
Time to discuss early-season MLB technique, while also putting a ticket into play, with #962 Detroit Team Total Over 4 (1:10 Eastern). I think Hisashi Iwakuma may be far more vulnerable than apparently do others in the marketplace.
One of the key notions that has been a part of the early-season MLB discussion threads, and I will make a lead topic next week when there are fewer NBA games, are the early-season rate stats that I use for tracking pitchers, those that take the geometry of baseball out of play. They are ominous for Iwakuma because you can see where the progressions are heading, and at the age of 36, there is also some inevitable life logic behind it –
K% BB% GB% SWS%
2015 21.5 4.1 50.4 10.6
2016 17.6 5.5 40.8 7.8
2017 10.8 12.1 42.9 6.9
We can add one more here that I don’t fully trust, because there is some judgment involved, but does matter –
O-Swing%
2015 37.1
2016 33.3
2017 28.9
When a pitcher loses his stuff, and with the Iwakuma average fastball having declined from 88.9 mph in 2015 to the current 85.9 it is going away, it becomes far more difficult to get batters to offer at something outside of the strike zone. That is an important part of the game for a guy to lose.
Now for some of the real magic behind the 2017 numbers – in opening 0-2/5.31, which is indeed poor, Iwakuma has benefitted from both a .211 BABIP and an 82.5 LOB%. It shows you how things could have been much worse, which is why FIP reads his first four starts at 7.51. To put that into perspective, of the 112 pitchers at 20 innings or more that rates dead last, and is more than a full run higher than anyone else (Tom Koehler at 6.46). I won’t be involved with the full game Over in this one because Justin Verlander is a bit of a wild card, his stuff looking a little better than the outcomes, but I will back the Tigers to make enough happen against a vulnerable pitcher.
As for the NFL Draft...
I have only been a follower in this marketplace, but for those that want a good read on some options from our pal Stephen Nover, who puts a lot of study into this stuff you can click right here.
And for your listening pleasure...
NBA Playoffs talk, mostly a general overview of some useful stuff, though not a focus on the particular games for Thursday -
The complete Point Blank Archive
@PregamePhd (a work in progress, feedback appreciated)